The Basics of Stock Market Trading and Technical Analysis
Stock market trading is the process of buying and selling shares of publicly traded companies. It is a popular form of investment that allows individuals to participate in the growth and success of businesses. However, successful trading requires knowledge and understanding of various factors that influence stock prices.
Understanding Technical Analysis
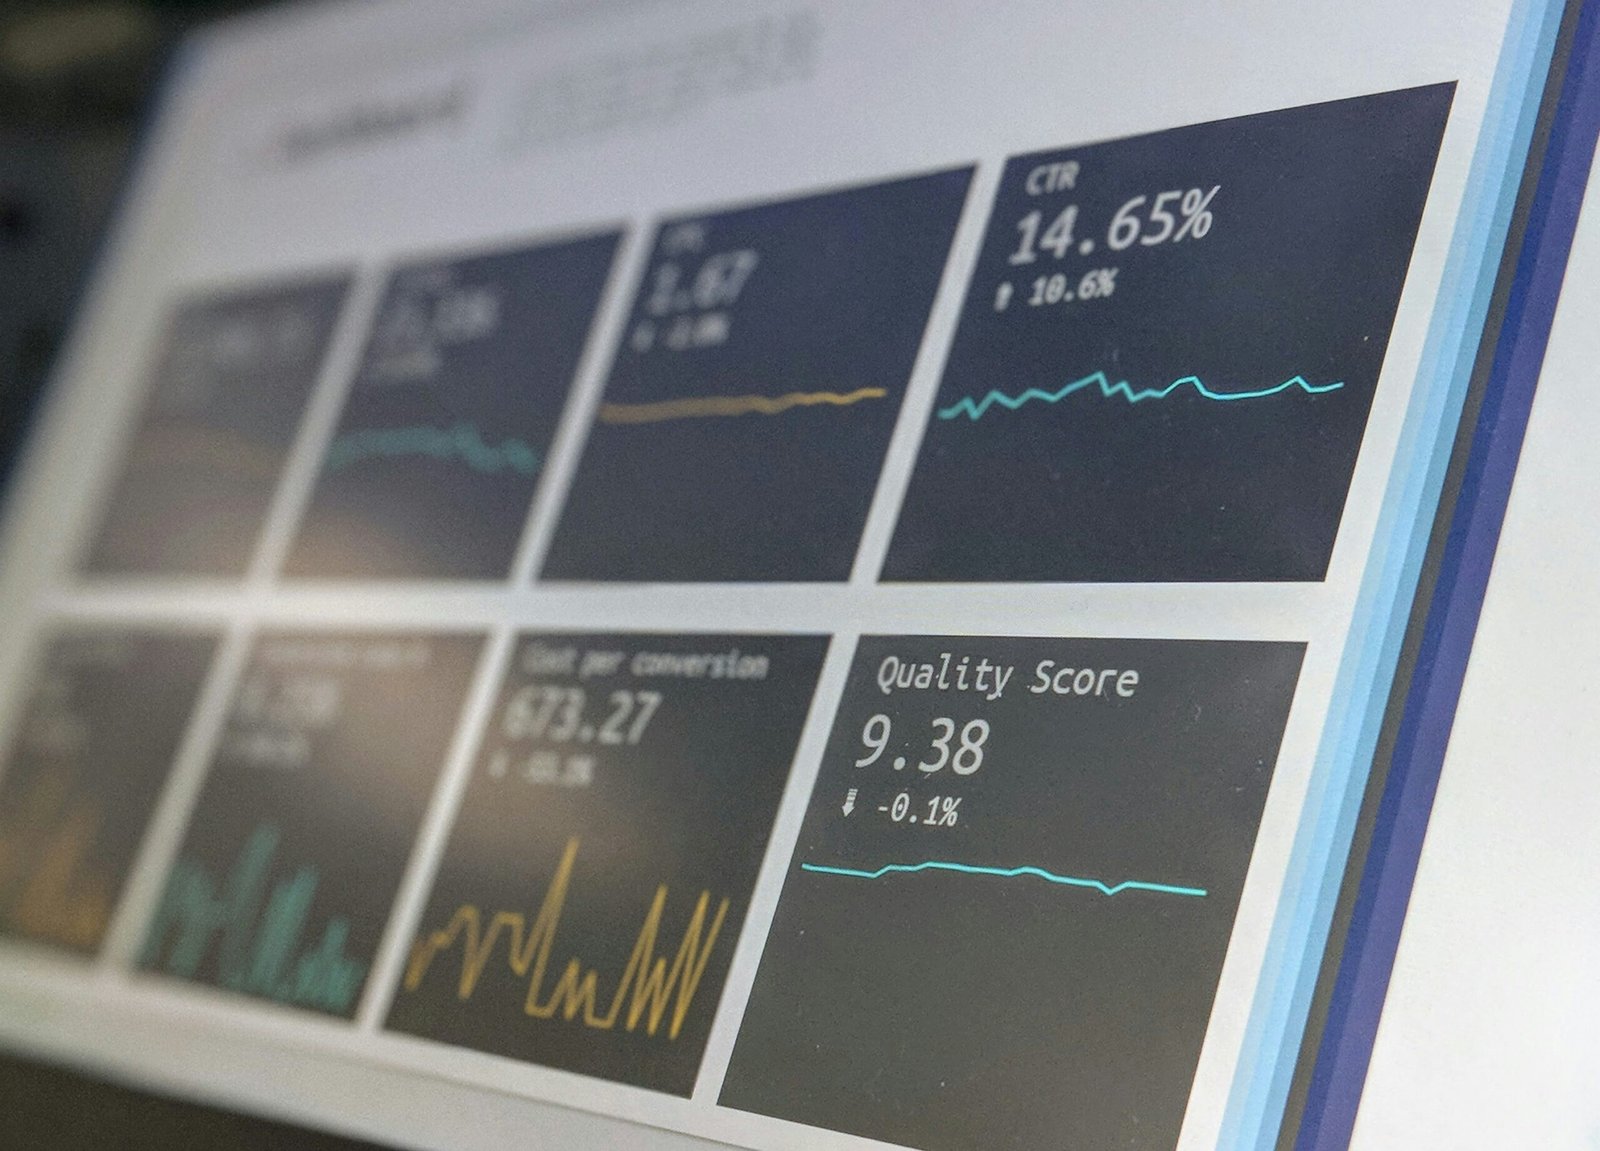
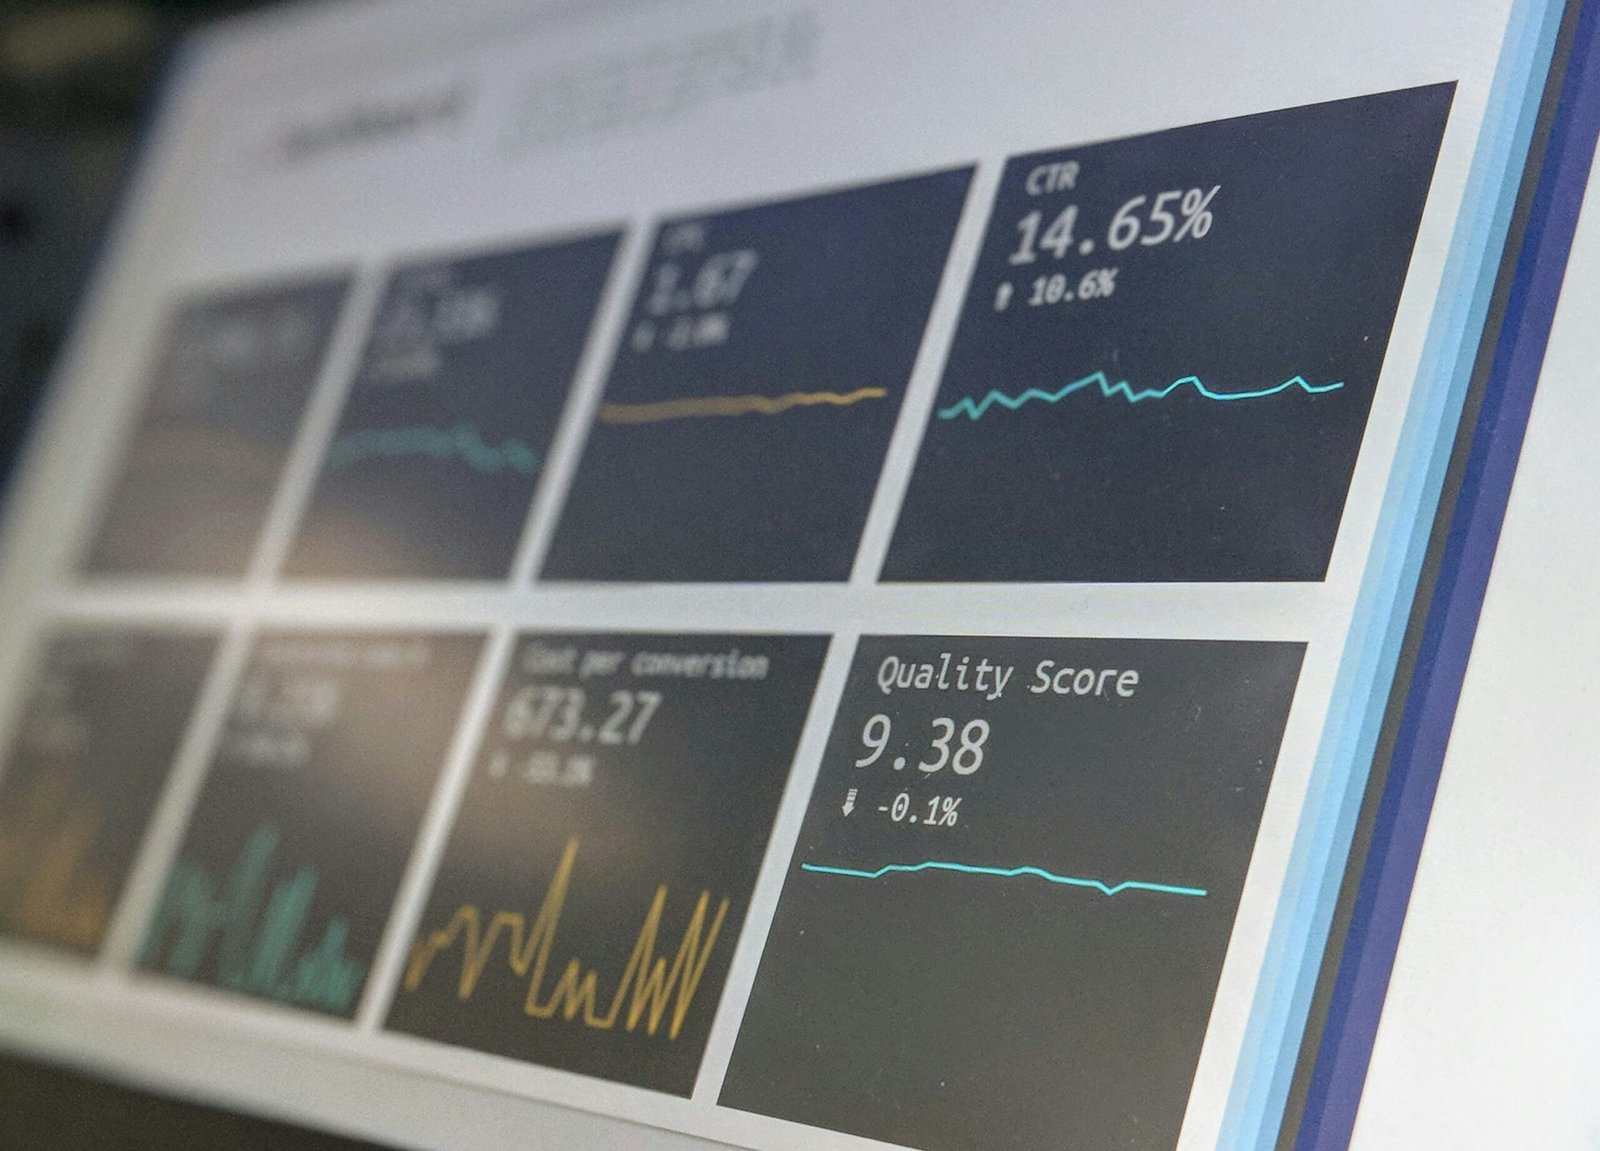
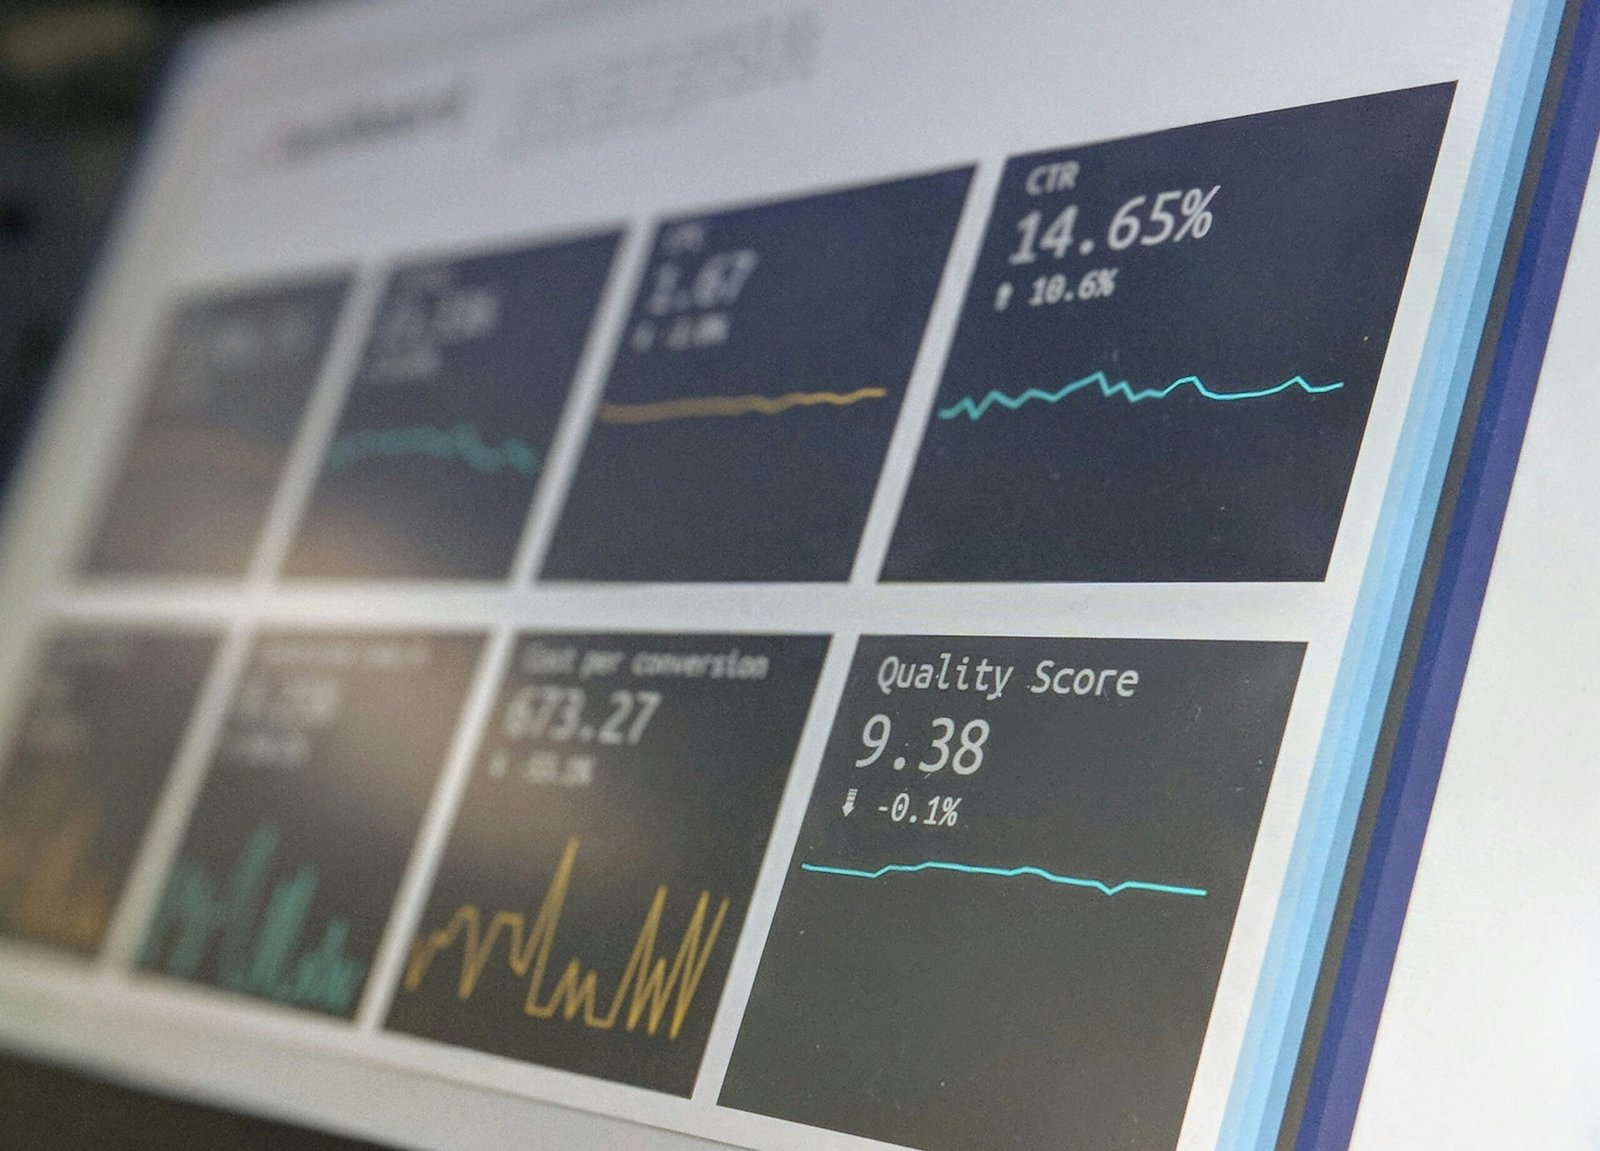
One approach to trading is technical analysis. This method involves analyzing historical price and volume data to predict future price movements. Technical analysts believe that stock prices follow trends and patterns that can be identified and used to make informed trading decisions.
There are several key concepts and tools used in technical analysis:
Trends:
Trends are one of the fundamental principles of technical analysis. They refer to the direction in which a stock’s price is moving. Trends can be classified as uptrends, downtrends, or sideways trends. By identifying the current trend, traders can make decisions on whether to buy, sell, or hold a particular stock.
Support and Resistance Levels:
Support and resistance levels are price levels at which a stock tends to stop falling or rising. Support levels act as a floor, preventing the price from dropping further, while resistance levels act as a ceiling, preventing the price from rising further. Traders use these levels to determine potential entry and exit points.
Indicators:
Indicators are mathematical calculations based on historical price and volume data. They are used to provide additional information and confirm signals generated by other technical analysis tools. Common indicators include moving averages, relative strength index (RSI), and MACD (Moving Average Convergence Divergence).
Candlestick Patterns:
Candlestick patterns are graphical representations of price movements. They provide insights into market sentiment and can indicate potential reversals or continuations of trends. Some commonly used candlestick patterns include doji, hammer, and engulfing patterns.
The Role of Fundamental Analysis
While technical analysis focuses on price movements and patterns, fundamental analysis takes into account the financial health and performance of a company. It involves analyzing factors such as earnings, revenue, and industry trends to determine the intrinsic value of a stock.
Both technical and fundamental analysis have their strengths and weaknesses. Some traders prefer to use a combination of both approaches to make well-informed trading decisions.
Developing a Trading Strategy
To be successful in stock market trading, it is important to develop a well-defined trading strategy. This strategy should outline your goals, risk tolerance, and the criteria you will use to select stocks. It should also include a plan for managing your trades, including setting stop-loss orders and profit targets.
Additionally, it is crucial to continuously educate yourself about the stock market and stay updated on current events and market trends. By staying informed and adapting your strategy as needed, you can increase your chances of success in stock market trading.
Conclusion
Stock market trading and technical analysis are complex subjects that require knowledge, experience, and careful analysis. By understanding the basics of technical analysis, incorporating fundamental analysis, and developing a solid trading strategy, individuals can increase their chances of making informed investment decisions and achieving their financial goals.


Leave a Reply