The Basics of Stock Market Trading and Technical Analysis
Stock market trading is the process of buying and selling shares of publicly traded companies. It is a popular form of investment that allows individuals and institutions to participate in the growth and success of businesses. One of the key tools used in stock market trading is technical analysis, which involves analyzing historical price and volume data to make predictions about future price movements.
Understanding Stock Market Trading
Before diving into the world of stock market trading, it’s important to have a basic understanding of how the stock market works. The stock market is a platform where buyers and sellers come together to trade shares of publicly listed companies. These shares represent ownership in the company and give investors the opportunity to profit from the company’s success.
Stock market trading can be done through various channels, including stock exchanges, brokerage firms, and online trading platforms. Investors can choose to buy and hold stocks for the long term, or engage in more active trading strategies to take advantage of short-term price fluctuations.
The Role of Technical Analysis
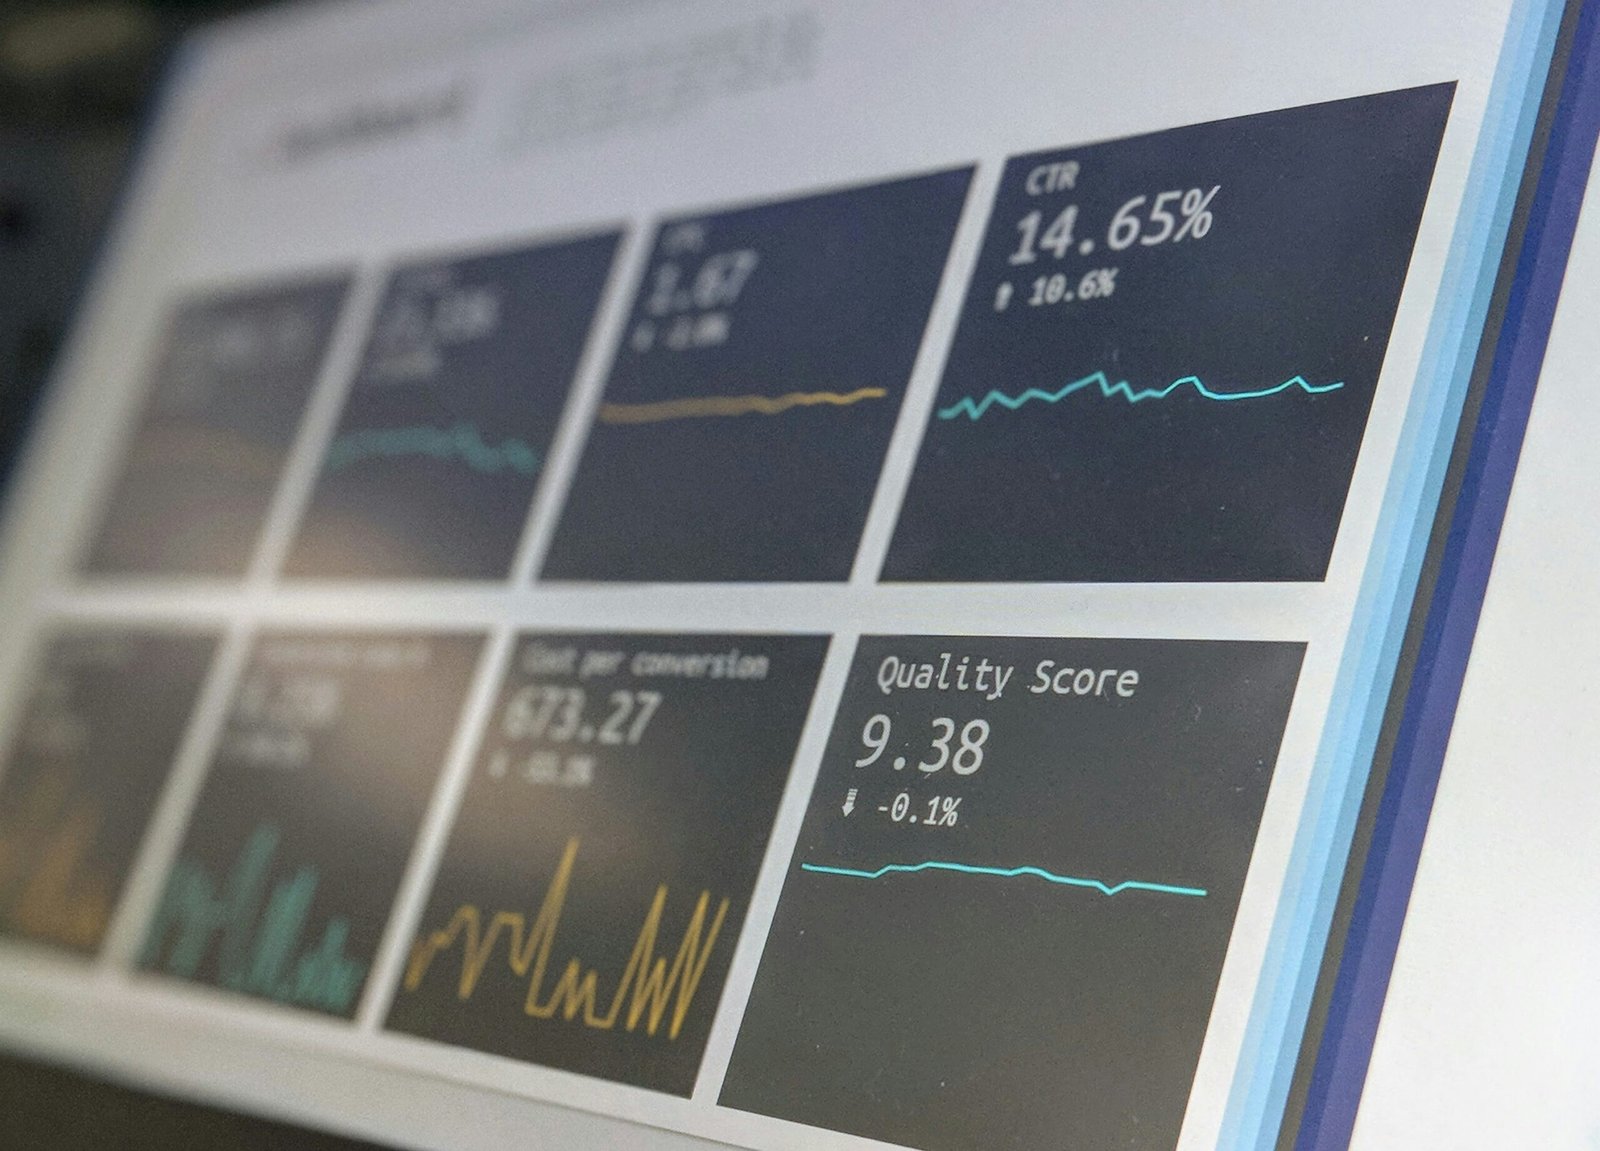
Technical analysis is a method used by traders to forecast future price movements based on historical price and volume data. It involves studying charts and patterns to identify trends and patterns that can be used to make informed trading decisions.
There are several key principles of technical analysis that traders use to analyze stock market data:
Trend Analysis
Trend analysis is a fundamental concept in technical analysis. It involves identifying the direction of the market, whether it’s in an uptrend, downtrend, or moving sideways. Traders use various tools and indicators to determine the strength and duration of a trend, which helps them make decisions on when to buy or sell.
Support and Resistance
Support and resistance levels are price levels at which stocks tend to find buying or selling pressure. Support levels act as a floor, preventing prices from falling further, while resistance levels act as a ceiling, preventing prices from rising further. Traders use these levels to identify potential entry and exit points.
Indicators and Oscillators
Technical analysts use a wide range of indicators and oscillators to identify potential trading opportunities. These include moving averages, relative strength index (RSI), and stochastic oscillators, among others. These tools help traders identify overbought or oversold conditions and potential trend reversals.
The Limitations of Technical Analysis
While technical analysis can be a valuable tool for stock market trading, it’s important to understand its limitations. Technical analysis is based on historical data and patterns, which may not always accurately predict future price movements. It’s also important to consider other factors, such as fundamental analysis and market sentiment, when making trading decisions.
Furthermore, technical analysis is not foolproof and can be subjective. Different traders may interpret the same data differently, leading to varying trading decisions. It’s important for traders to develop their own trading strategies and risk management techniques based on their individual goals and risk tolerance.
Conclusion
Stock market trading and technical analysis go hand in hand. By understanding the basics of stock market trading and using technical analysis tools, traders can make informed decisions and increase their chances of success in the stock market. However, it’s important to remember that no trading strategy is guaranteed, and it’s always important to do thorough research and consider multiple factors before making any investment decisions.


Leave a Reply